


How Cardisiography works
Cardisiography records the heart's electrical activity as a three-dimensional vector loop and evaluates it with an AI-powered algorithm.
Cardisiography does not diagnose; it provides decision support to the physician in the diagnostic process. The physician makes the diagnosis. The report presents indicators of ischemia, arrhythmias and structural heart disease for the physician's assessment.
What it helps detect

Rhythm disorders
All heartbeats registered during the 4-minute measurement are shown in the 3D absolute cardiogram; supraventricular and ventricular extrasystoles and atrial fibrillation are clearly visible.

Coronary diseases
In patients with chest pain and an unremarkable ECG, the VCG can help detect early blood flow disturbances (myocardial ischemia) even before cell damage occurs.

Structural heart diseases
In cases of suspected structural heart disease, arrhythmia, or CHD/ischemia, Cardisiography provides decision support for the physician's assessment of the condition.
What Cardisiography is
Cardisiography is a non-invasive cardiac assessment based on digital vectorcardiography (VCG). It uses AI-powered analysis to generate a 3D ECG and a 19-lead ECG recording (compliant with ESC guidelines). The test is performed while the patient is in a resting state, with results within 1 minute of the recording.

How it differs from a conventional ECG
The classic 12-lead ECG records electrical signals linearly; the vectorcardiogram shows the directional course of electrical excitation in 3D space. Cardisiography adds the vectorcardiogram and AI-powered analysis to that recording.
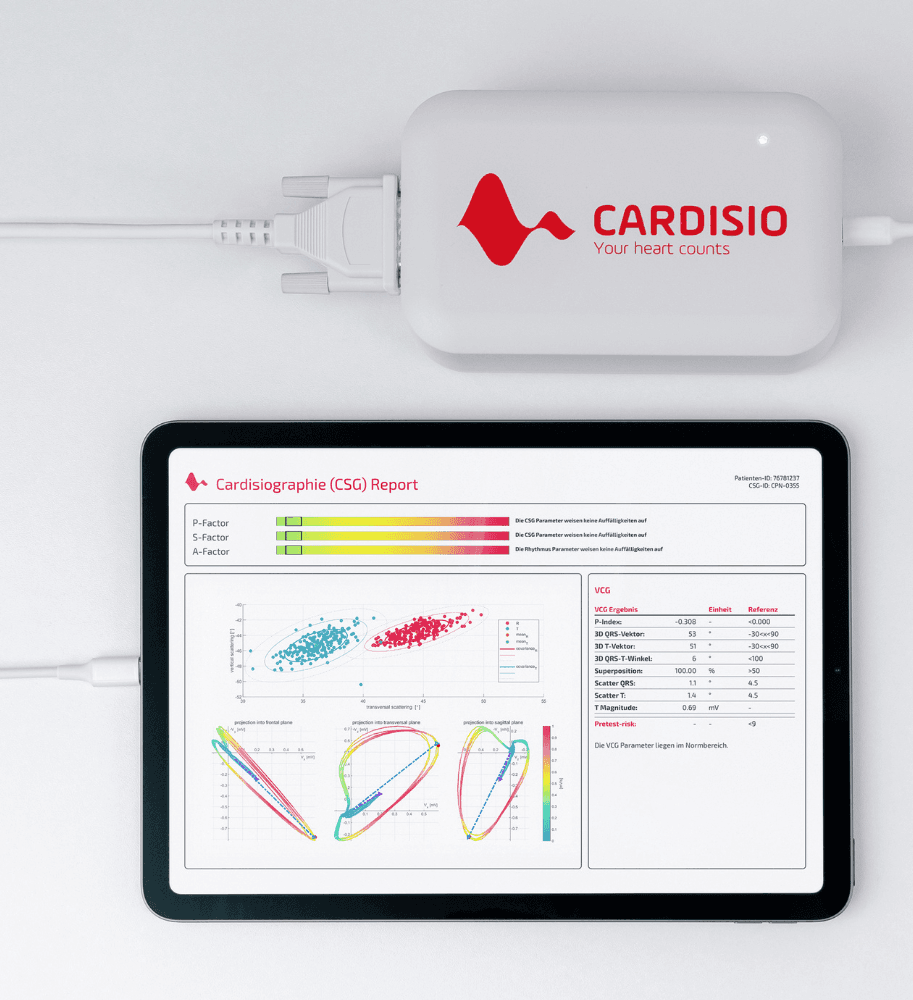
AI-powered analysis
The algorithm assesses individual ischemia risk from the spatio-temporal analysis of QRS and T-loops.
Technical facts
- Electrodes5 fresh disposable electrodes per measurement.
- Recording timeFour-minute recording.
- Time to resultResults within 1 minute of the recording.
- Data pointsMore than 3.2 million data points processed in a cloud-based application.
- OutputA 3D ECG and a 19-lead ECG recording (compliant with ESC guidelines).
- Equipment requiredWindows 10+ PC or laptop with internet, and a data collector incl. electrode cable.
Values as stated by the manufacturer.
Clinical benefits

Three-dimensional vector loop
The VCG shows the directional course of electrical excitation in 3D space. This can reveal complex changes, such as a heart attack masked by a bundle branch block.

Four-minute rhythm analysis
Unlike conventional ECGs, which record for only a few seconds, Cardisiography analyzes the heart over four minutes. This allows the physician to detect intermittent rhythm disturbances more reliably.

At rest, without exercise
The test is non-invasive and performed while the patient is in a resting state; no stress test is needed.
Advantages at a glance

Non-invasive
The test is non-invasive and performed while the patient is in a resting state; no stress test is needed.

Four minutes
Unlike conventional ECGs, which record for only a few seconds, Cardisiography analyzes the heart over four minutes.

Five electrodes
The test is performed much like an ECG, with five electrodes, at rest.
In 1 minute
Results within 1 minute of the recording.

A readable report
The report is delivered as a PDF and laid out so the physician can interpret it easily.
The test in three steps
Results are available within 1 minute of the recording; a medical professional then discusses the results with the patient.
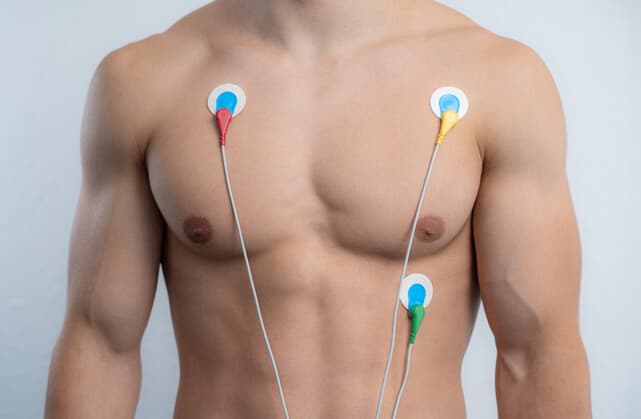
Recording
In the four-minute recording, five electrodes are attached to the body, similar to an ECG.
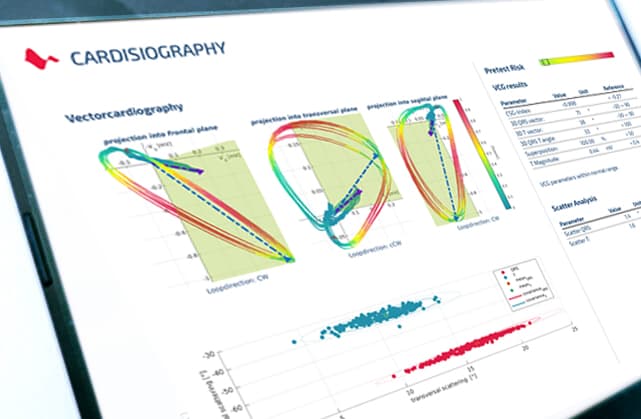
AI analysis
The recorded parameters are immediately transmitted to the Cardisio server and processed into a report using an AI algorithm.

Conversation with the physician
A medical professional discusses the results with the patient.
What the report contains
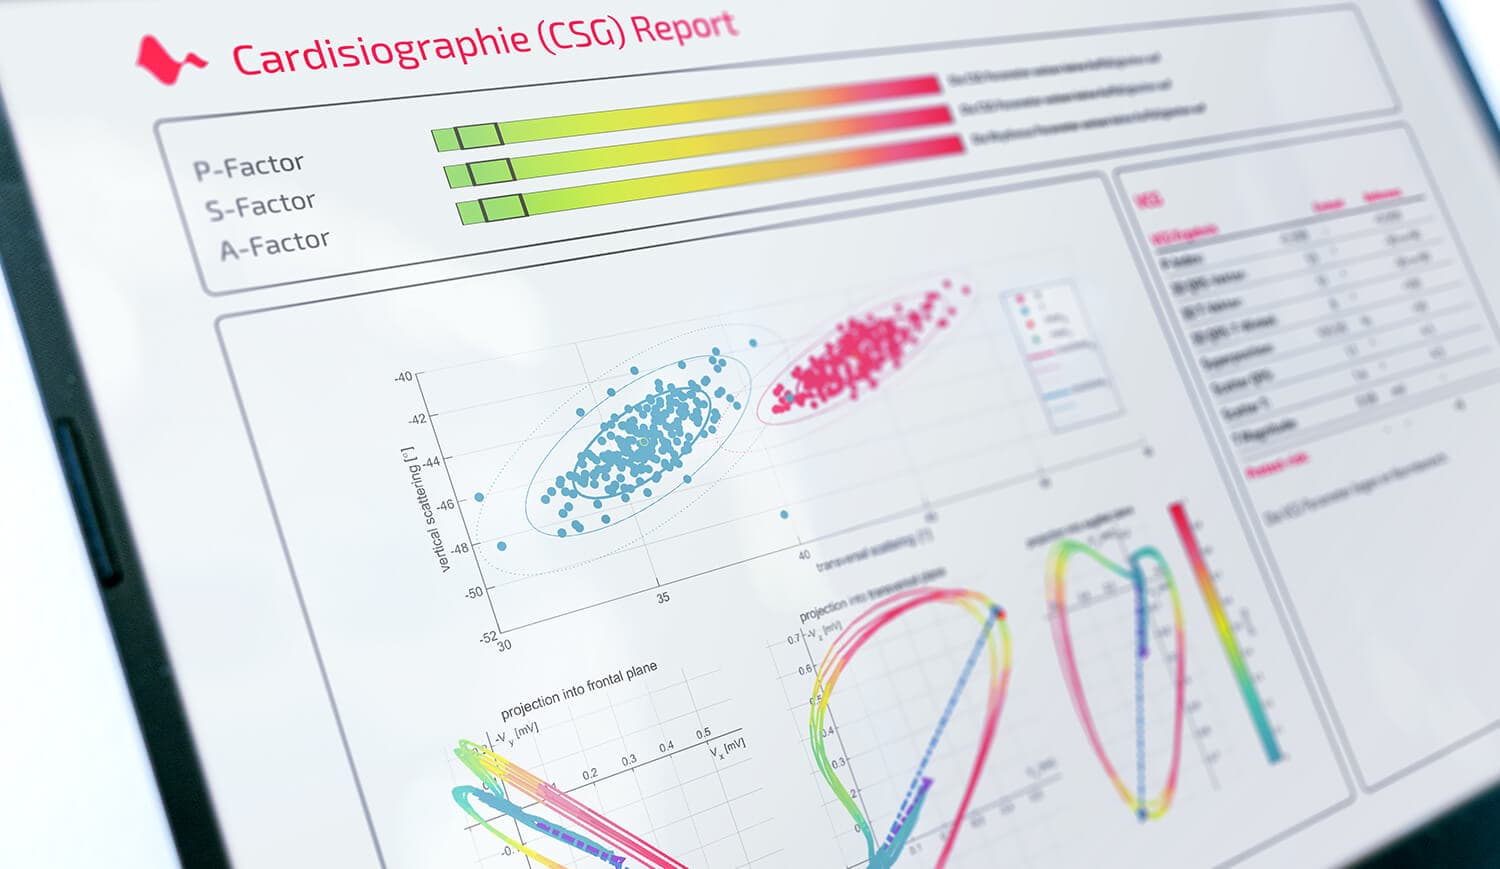
- The report is a seven-page PDF: vector analysis, absolute cardiogram, ECG and rhythm analysis, two pages of 12-lead ECG, additional leads and interpretation.
- AI-powered indicesPerfusion, structural heart disease, and arrhythmia index.
- Heart vectorsRepresentation of heart vectors and their positions in space; vector loops in three planes, with colour coding for velocity, rotational direction, and block patterns.
- Selected parametersSelected vectorcardiography and ECG parameters; conventional ECG parameters are compared against normal values and deviations are reported automatically.
- 12-lead ECGPresentation of 12-lead ECG, incl. Nehb leads.
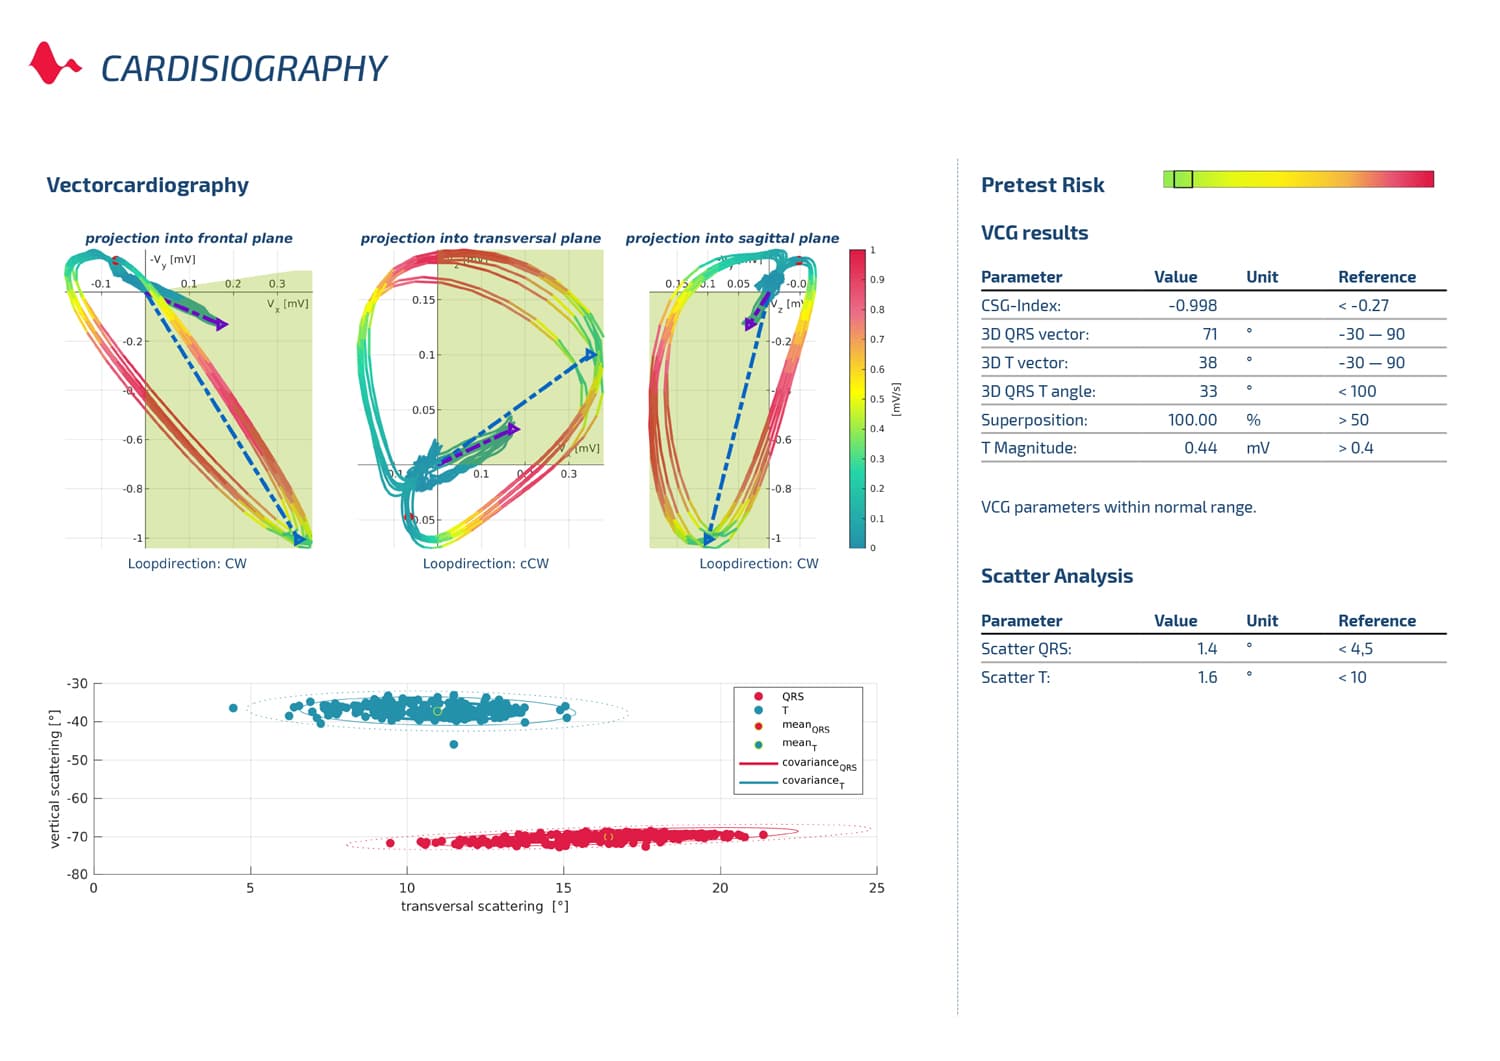
Vector analysis
Vector loops and maximum vectors, scatter of the maximum vectors, the CSG Index and vectorcardiography parameters. The optional pre-test probability also appears on this page.
An optional pre-test can be completed before the recording. It classifies the probability of coronary artery disease as low, intermediate or high based on risk factors, using the Diamond-Forrester method. If the questions are skipped, there is no pre-test result; if they are answered, the result appears on the first page of the report.
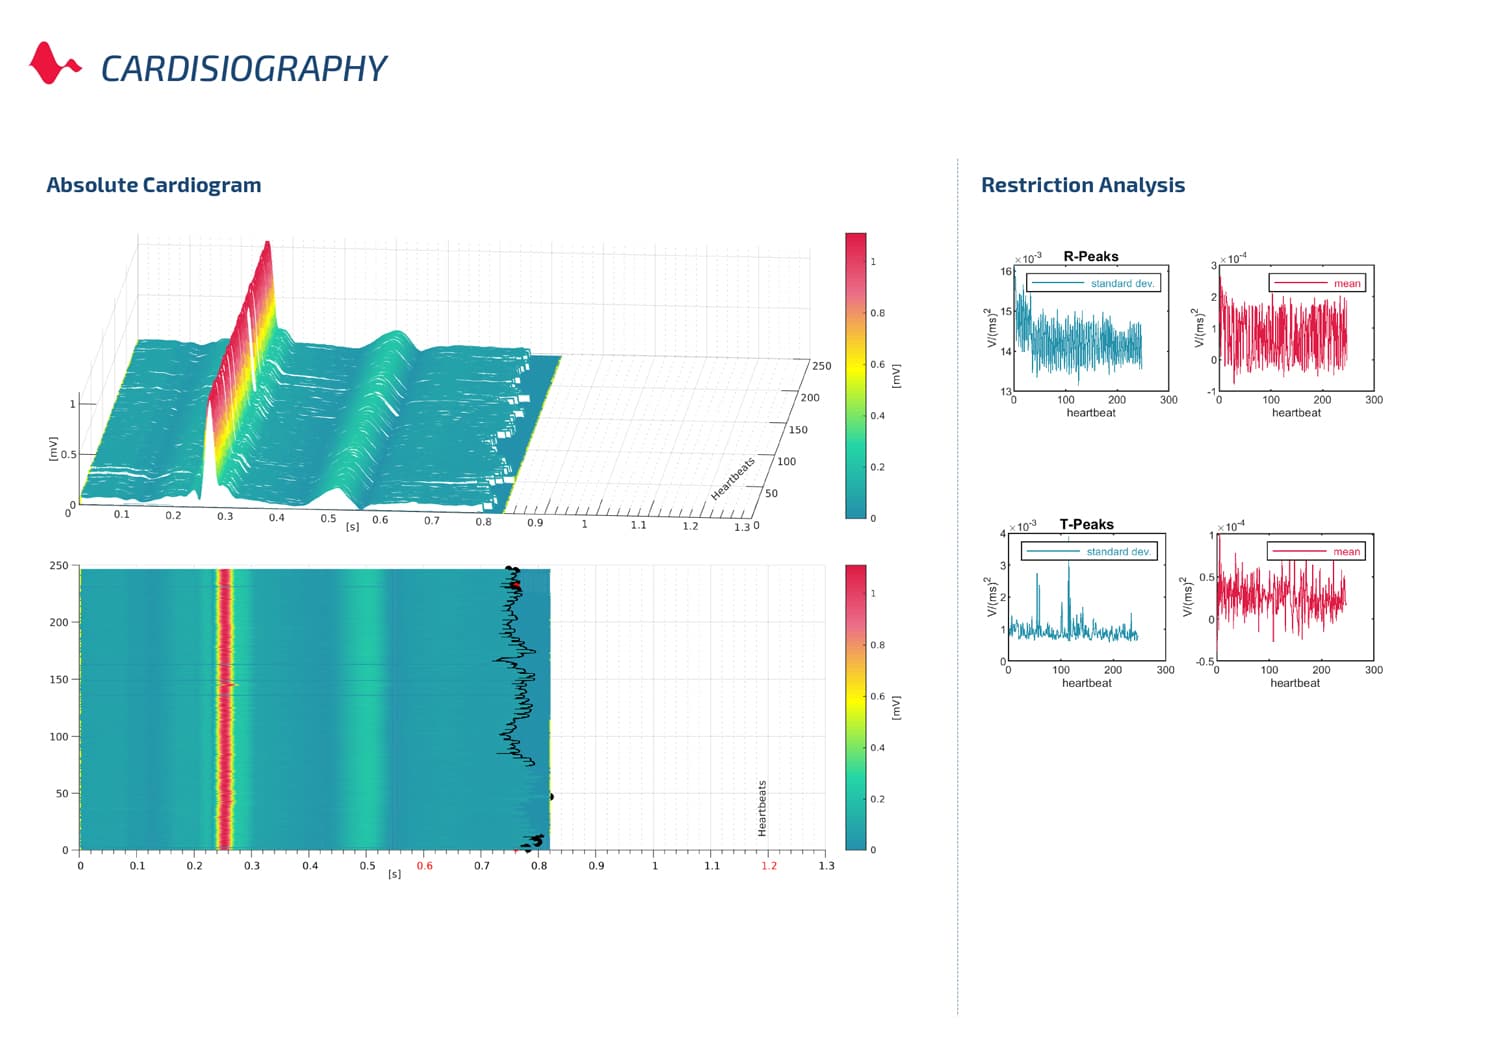
Absolute cardiogram
Absolute cardiogram, heart rate variation and restriction analysis.
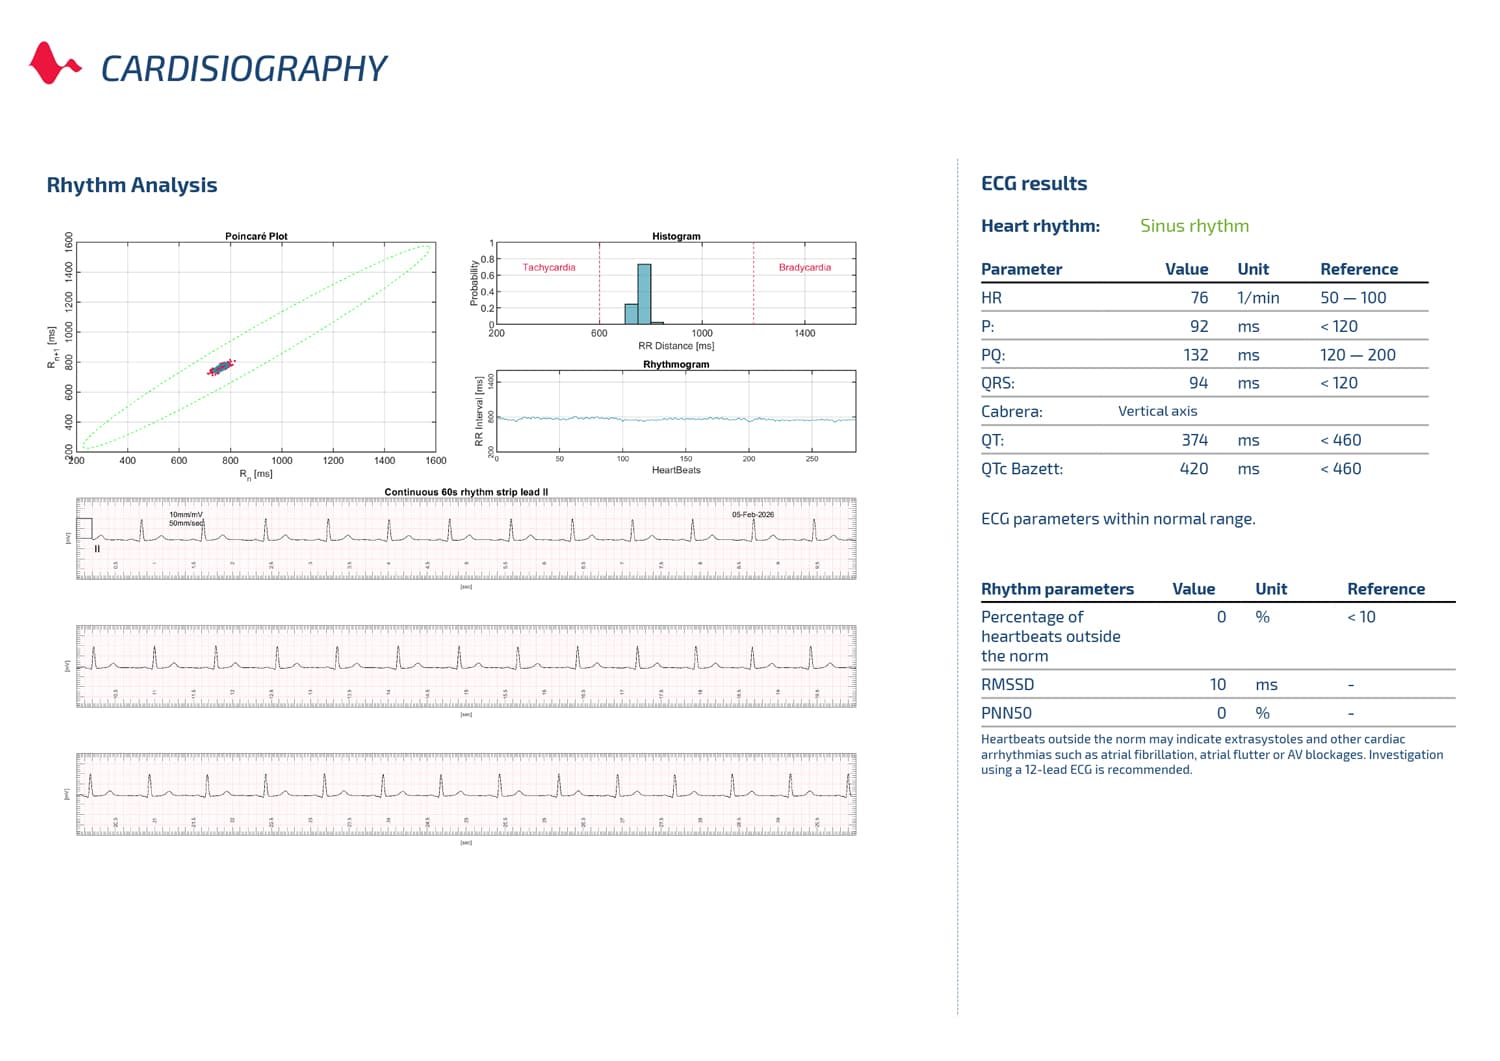
ECG and rhythm analysis
Selected ECG parameters, automatic rhythm identification, rhythm strip, Poincaré plot, histogram and rhythmogram.
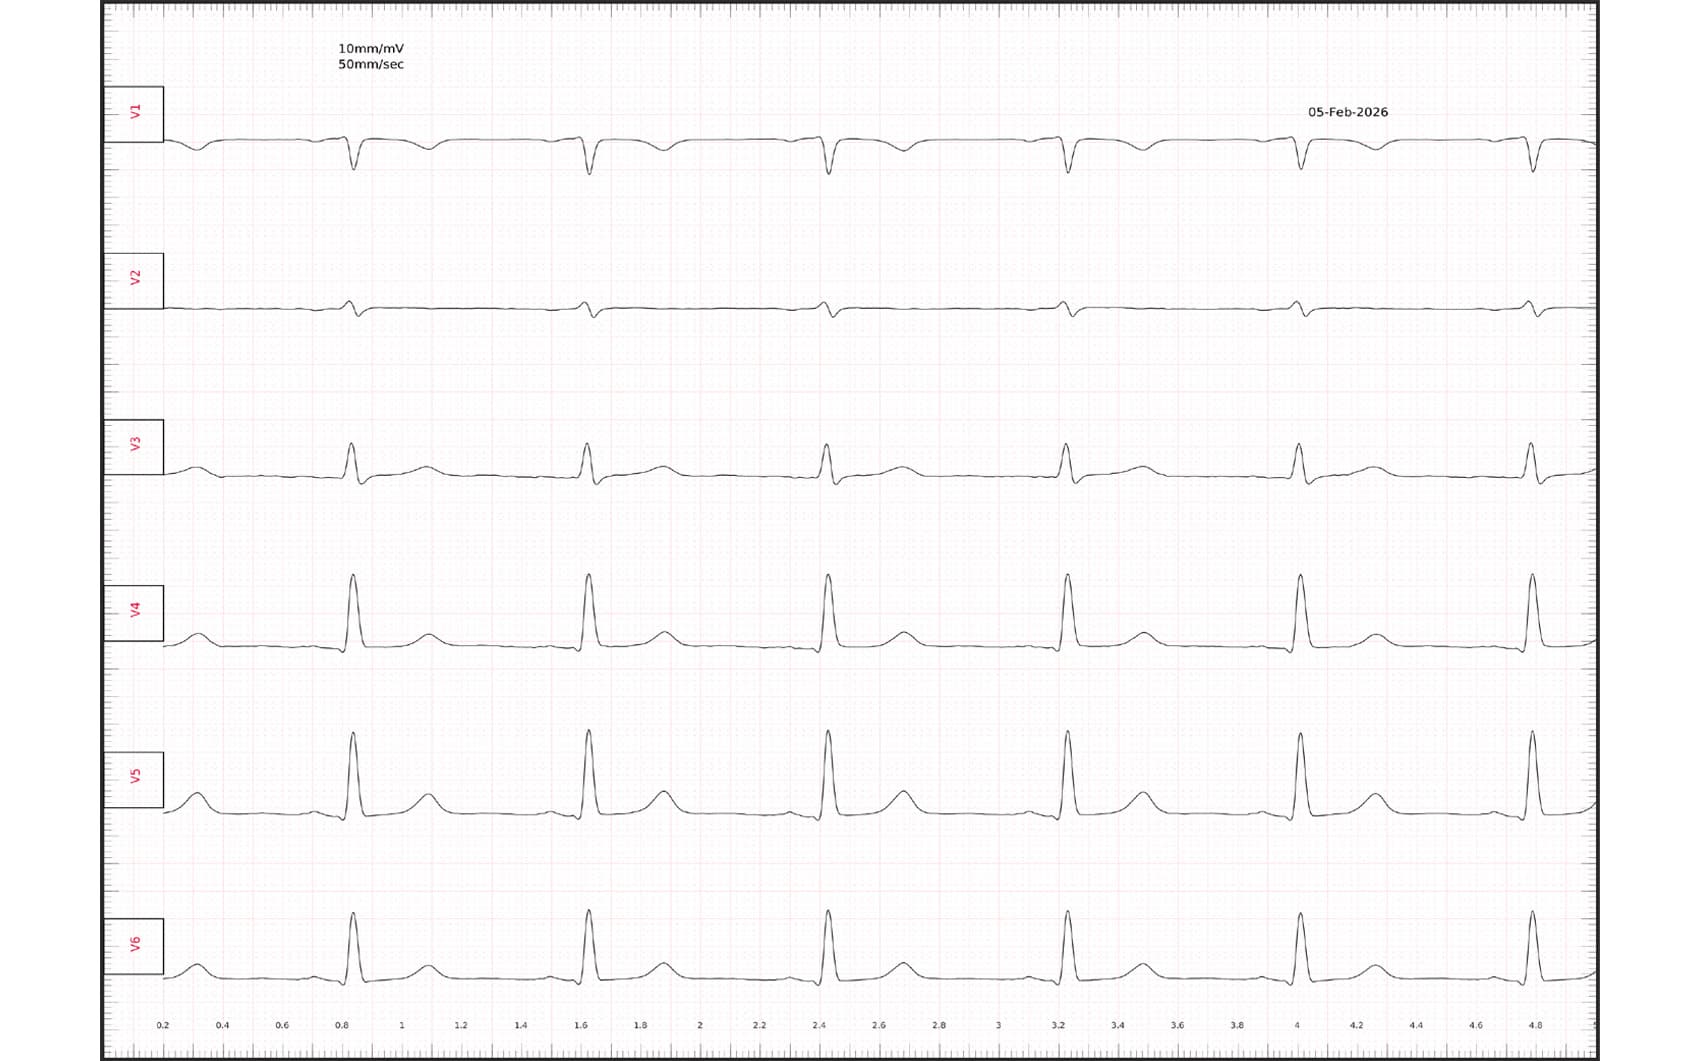
12-lead ECG
Two pages of limb leads (I, II, III, aVR, aVL, aVF) and chest leads (V1–V6). A 5- or 10-second signal is shown at 25 or 50 mm/s and 10 mm/mV.
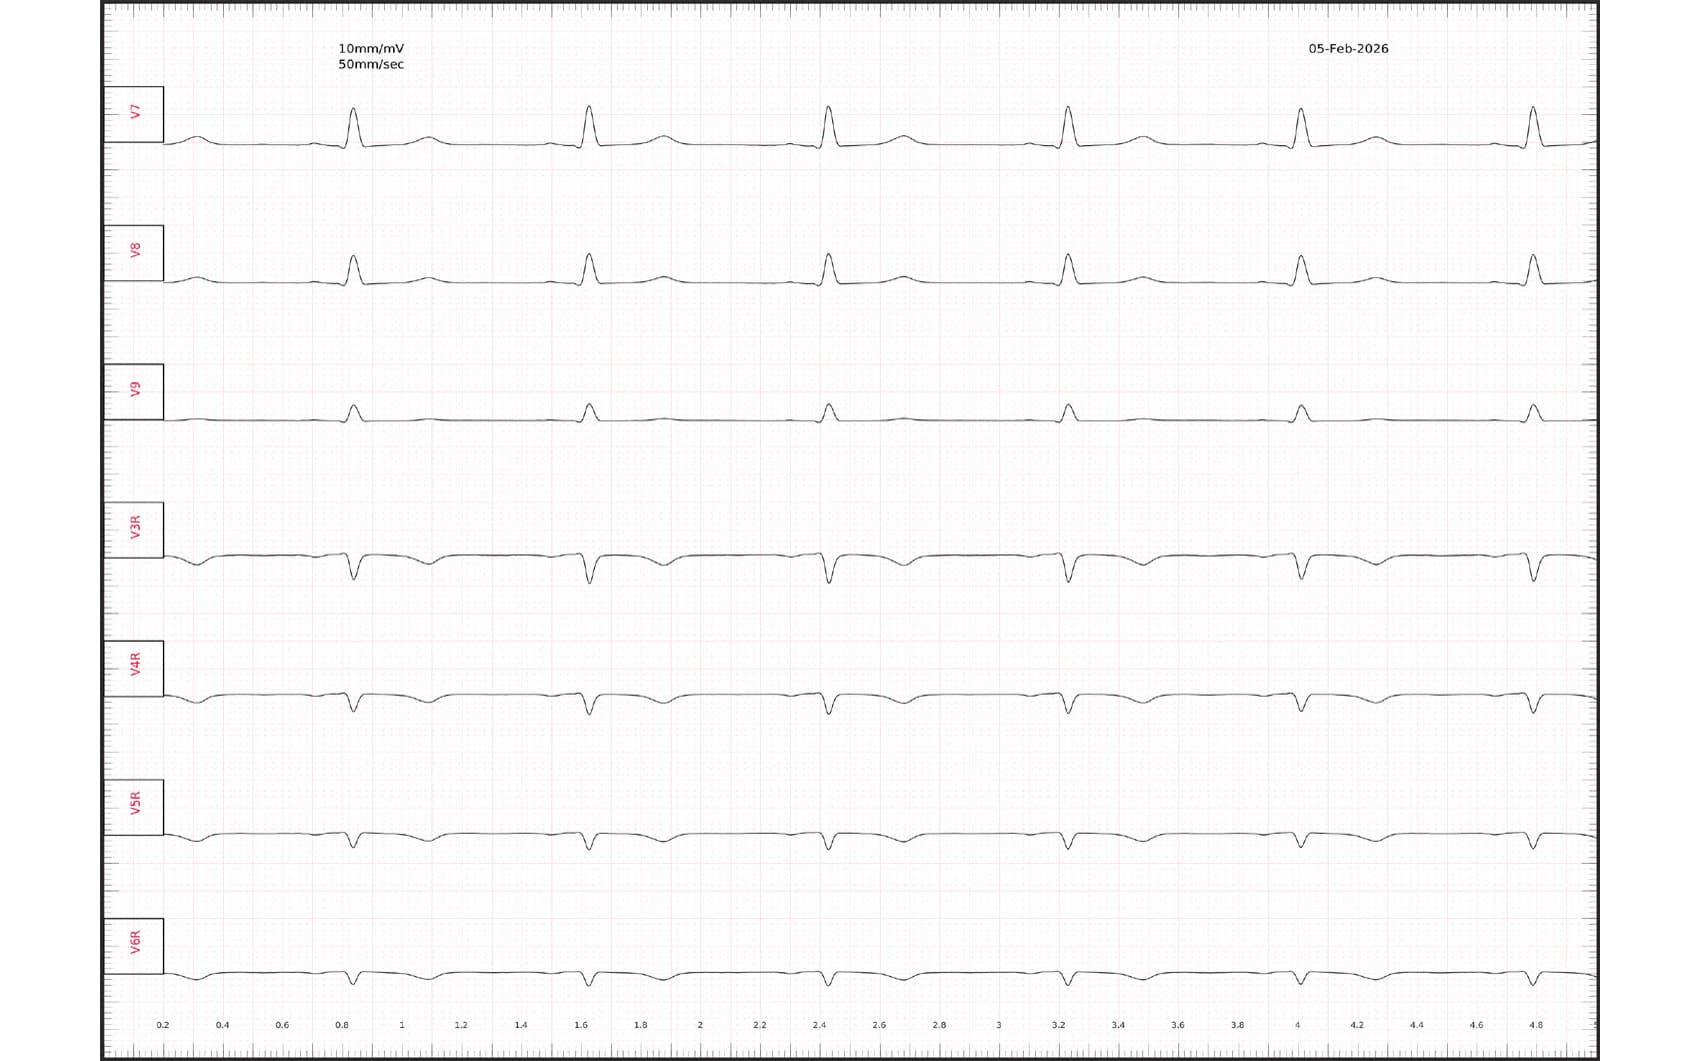
Additional leads
Left posterior leads V7–V9 and right ventricular leads V3r–V6r.
Interpretation
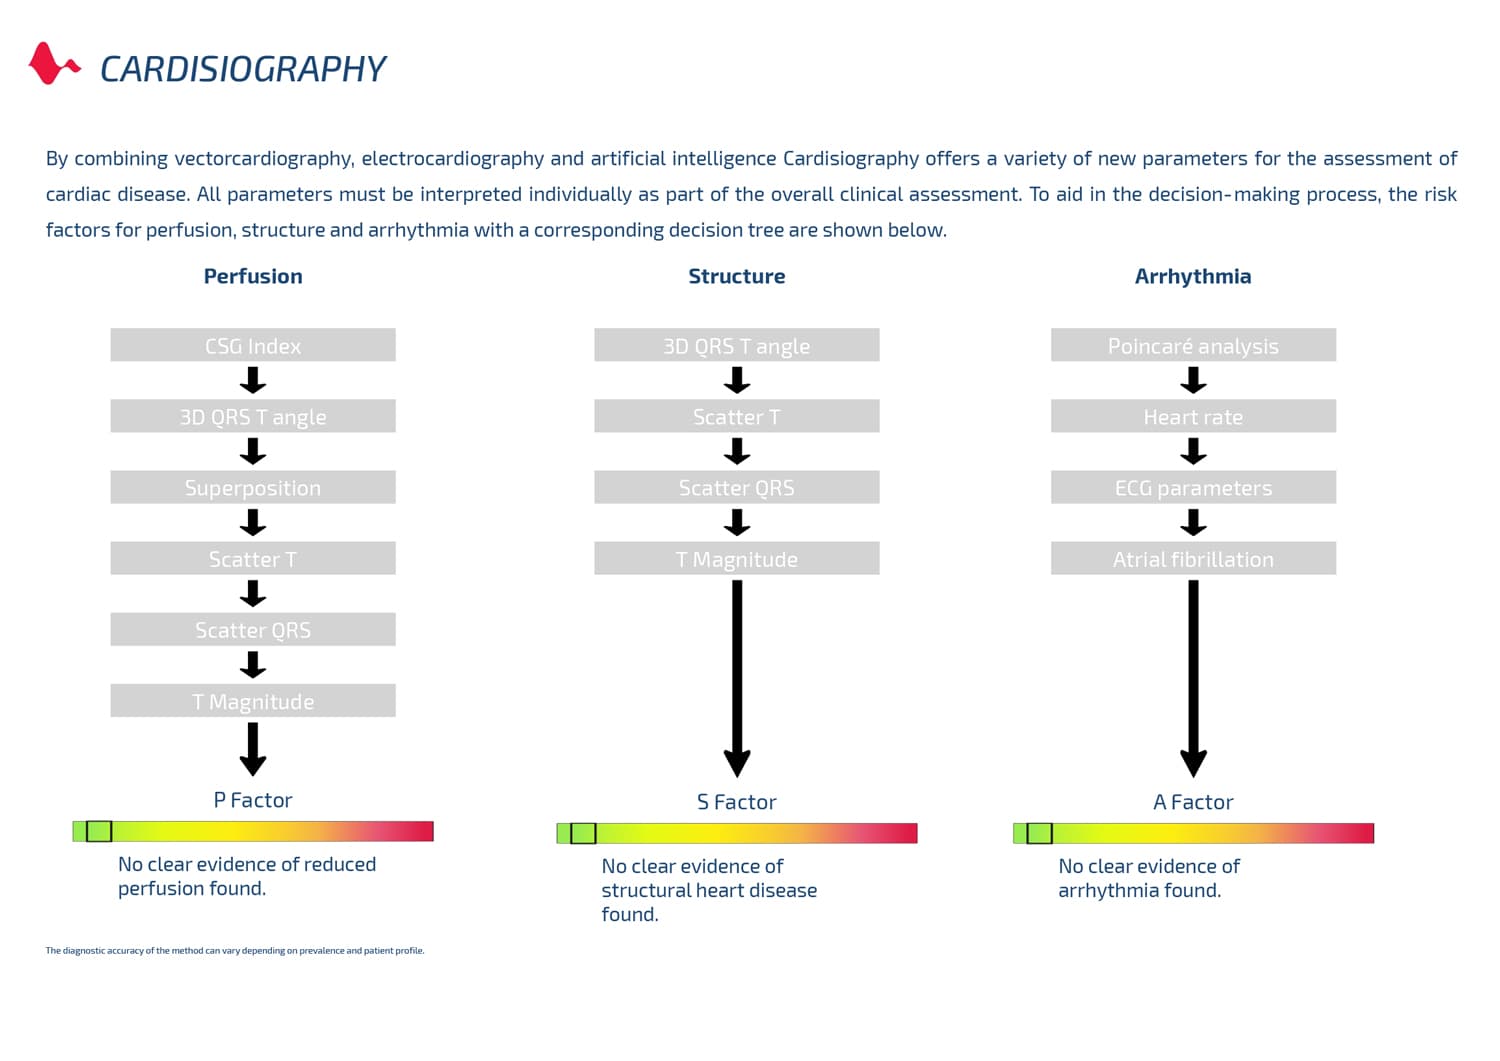
An overview and weighting of the findings. The P, S and A factors are shown as green, yellow or red.
Four-minute rhythm analysis
The heart's electrical activity is recorded for four minutes. The RR intervals between successive beats are measured over this period and related to each other. The report shows them in four charts. An irregular rhythm, such as possible atrial fibrillation, becomes visible in these charts and is presented for the physician's assessment.
Rhythm strip
Shows successive RR intervals across the recording in a single strip.
Poincaré (Lorenz) plot
Pairs each RR interval with the next one. In a regular rhythm the points cluster together; in an irregular rhythm they scatter.
Histogram
Shows the frequency distribution of RR intervals. A wide distribution may point to an irregular rhythm.
Rhythmogram
Shows how RR intervals change over the recording. Slight fluctuation is physiological.
If the rhythm cannot be determined for technical reasons, the report states this. No medical conclusion is drawn from this.
Source: S. Hargittai. Is it possible to detect atrial fibrillation by simply using RR intervals? Computing in Cardiology 2014, Cambridge, MA, pp. 897–900.
The P, S and A factors
The interpretation page summarises the analysis in three factors. Each factor is shown as green (0), yellow (1) or red (2). The factors are not a diagnosis; they give the physician a pointer to the direction in which the patient may be investigated further, in line with guidelines.
- 0 · Green
- 1 · Yellow
- 2 · Red
P: perfusion
Points to possible reduced blood perfusion of the heart at rest, for example due to macro- or microvasculopathy. Derived from the CSG Index and related vectorcardiography parameters.
S: structure
Points to possible structural changes in the heart muscle. Takes into account relevant deviations from ECG and vectorcardiography norms.
A: arrhythmia
Points to a possible arrhythmia, such as extrasystoles, atrial fibrillation, atrial flutter, conduction disorders, tachycardia or bradycardia.
Frequently asked questions
How long does the test take?
The recording takes four minutes. Results are available within 1 minute of the recording.
Does the patient need to exercise?
No. Cardisiography is non-invasive and is performed while the patient is in a resting state.
Who interprets the result?
The report is produced by an AI-powered algorithm; a medical professional discusses the results with the patient, and the physician makes the diagnosis.
Further information

Clinical evidence
Find out moreClinical evidenceStudies on Cardisiography: each study's population and its own results; supplementary literature on the technology at the end.
For clinicians
Find out moreFor cliniciansCardisiography for hospitals, clinics and private practices: how it fits your workflow, what it needs, and how to request a quote or demo.
For patients
Find out moreFor patientsWhat the Cardisiography test is, how it is done and what the result means, in plain and calm words.